apna search bar

Custom Search

Followers

Showing posts with label Forex Strategy. Show all posts

Thursday, October 15, 2009

Hedging Lots Strategy

1. Just for simple explanation i assume that there is no spread. Take position with any directions we like, example: Buy 0.1 lot at 1.2160. At the same time or a few seconds after placing Buy, put Stop Sell 0.3 lot at 1.2130. Attentions the Lots.

2. If the TP at 1.2190 not reached and the price goes down and reach SL or TP at 1.2100 then we have profit 30 pips because Stop Sell has become an active Sell before.

3. But if TP and SL at 1.2100 not reached and the price goes up again, we have to had Stop Buy already at 1.2160 to anticipate. At the time Stop Sell was reached and became active Sell 0.3 lot (pic: number 2), we have to immediately place the Stop Buy 0.6 lot at 1.2160 (pic: number 3).

4. If the price goes up and reach SL or TP at 1.2190, then we have profit 30 pips too.

5. If the price goes down again without reaching any TP, then continue anticipating with Stop Sell 1.2 lot, then Stop Buy 2.4 lot,…and next. Continue this sequence until we meet the profit. Lots : 0.1, 0.3, 0.6, 1.2, 2.4, 4.8, 9.6, 19.2, 38.4 and 76.8.

6. At this example i use 30;60;30 configuration (TP 30 pips, SL 60 pips and Hedging Distant 30 pips). Otherwise we can try use 15;30;15, 60;120;60. Also we can try to maximizing profit by testing 30;60;15 or 60;120;30 configurations.

7. Considering the spread, choose the pair are most tightest spread like Euro/Usd. Usually the spread is only around 2 – 3 pips. More tight the spread, more absolute the winning we got. And I think I found the “Never Loss Strategy”…let the price move to anywhere he likes, we’ll get the profit anyway.

Volatility-based currency trading

Market volatility can be a complex subject, but understanding a few basic principles can help you implement strategies to capitalize on volatility extremes.


Volatility-based trading approaches have traditionally been popular among hedge funds, commodity trading advisors, and other professional traders. There are many ways to gauge volatility and incorporate it in a trading strategy. Of the different ways to characterize and trade volatility, the best are based on the tendency of volatility to “revert to the mean.”

The premise behind volatility mean reversion is that periods of extraordinarily high volatility should be followed by periods of lower, more normalized volatility. Similarly, periods of extraordinary low volatility should be followed by periods of higher, more normalized volatility. This tendency is reflected by the familiar progression of a market that meanders in a narrow trading range (a low-volatility condition), only to explode out of the consolidation and embark on a strong price trend (a highvolatility condition). Eventually, the price move exhausts itself, at which point volatility will again fall to a lower level.

We’ll analyze the two simple methods for trading volatility in the forex market: inside days and shortterm/ long-term volatility comparisons.


Consecutive inside bars
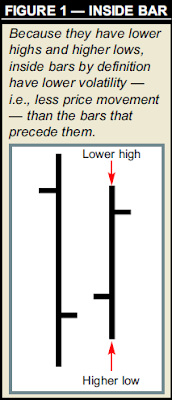
An inside bar is a bar whose range is contained within the prior bar’s range — that is, the bar’s high and low do not exceed the previous bar’s high and low (see Figure 1). They are easy to identify visually and should be one of the basic patterns traders should notice immediately.

Inside bars by definition have lower volatility — that is, less price movement — than their preceding bars, and successive inside bars reflect progressively shrinking volatility. Per the mean-reversion theory, the more inside bars, the higher likelihood of a volatility surge or a breakout scenario.

The following volatility trade can be implemented after at least two consecutive inside bars have formed. This type of strategy is best employed on daily charts; the longer the time frame, the more significant the potential breakout.

The strategy works for both longs or shorts. Although entry orders can be placed on both sides of the market, traders should use other tools to determine the bias for a particular trade. For example, if the inside days occur within a bullish chart pattern, such as a developing ascending triangle, this increases the likelihood of an upside breakout. On the other hand, if the inside days are developing within a descending triangle formation, this increases the likelihood of a downside breakout. Here are the rules for a long trade setup:

1. Buy above the high of the most recent inside bar.
2. Place a stop-and-reverse (SAR) order a few pips (approximately 5 to 10 pips, depending on the bid-ask spread) below the low of the most recent inside bar. The purpose of the SAR order is to reverse the position if the initial move turns out to be a false breakout.
3. If the position moves higher by the risk amount (the difference between the entry price and the stop price), sell half the position and replace the SAR order with a trailing stop.
4. If the SAR order is triggered after the entry, place a stop a few pips above the high of the most recent inside bar.
Short trades: For a short trade, the rules are the same except that you enter below the low of the most recent inside day and place an SAR order a few pips above the high of the most recent inside day.

Figure 2 shows two consecutive inside bars in the U.S. dollar/Canadian dollar (USD/CAD) rate. Applying the strategy, a buy order is placed above the high of the most recent inside bar, while a stop is placed below the low of the most recent inside bar. The long order is triggered and a 200-pip rally ensues with virtually no retracement.

Figure 3 shows a more complex trade example in which the SAR order is triggered. Because of the bullish implications of the ascending triangle that was forming when the two inside bars appeared, the long-trade entry rules were executed:

1. We placed an order to go long a few pips above the high (.7660) of the most recent inside day. The order was triggered.
2. We placed an SAR order a few pips below the low of the most recent inside day at .7600 for a risk of approximately 60 pips. The SAR was triggered when the market broke out of the bottom of the triangle, and we sold the original long position and entered into a new short position.
3. When the market moved lower by the risk amount (60 pips), we sold half the position (at .7540). We then used a 30-pip trailing stop on the remaining position.

The low on April 14, 2004 was .7299, and we exited the remaining half of the position at .7329.


Volatility comparison

Currency option volatilities measure the rate and magnitude of the past and potential future changes in a currency’s price, and they can be a useful tool for timing currency movements.

Implied option volatilities, which are reflected in option premiums, are the market’s current estimate of the future fluctuation of a currency’s price. Historical (or statistical) volatility, which reflects past price movement, is typically measured by calculating the annualized standard deviation of price changes over a given period (e.g., 20 days, 100 days).
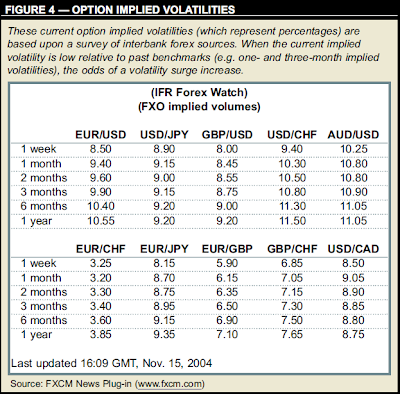
Figure 4 shows only current option implied volatilities (which are based upon a survey of interbank sources). Traders implementing this strategy would need to keep a journal tracking historical implied volatilities. Onemonth and three-month implied volatilities are two of the most commonly benchmarked time frames.

When option volatilities are low, traders should look for potential breakouts. Current implied volatility should be at least 25 percent lower than historical implied volatility. (It is best to measure against actual historical volatility, but that data is not always readily available.) Conversely, when option volatilities are high, traders should look for range trading opportunities.

Typically, when a currency trades in a range, its option volatility will decline, because by definition range trading means lack of movement.
When option volatilities make a pronounced down move, it is usually a sign of a significant potential price move and upcoming trade opportunity.

This characteristic is very important for both range and breakout traders.
Traders who usually sell at the tops of ranges and buy at the bottoms can use this approach to predict when their strategy could potentially stop working, because if volatility becomes very low, the likelihood of continued range trading decreases.

On the other hand, breakout traders can monitor option volatilities to make sure that they are not buying or selling into false breakouts. If volatility is at average levels, the likelihood of a false breakout increases. Alternatively, if volatility is very low, the probability of a real breakout is higher. However, traders must be careful because volatilities can have long downward trends, as they did between June and October 2002. Therefore, declining volatilities can sometimes be misleading. What traders need to look for is a sharp move in volatility, rather than a gradual one.

Figure 5 shows an example in the U.S. dollar/Swiss franc rate (USD/CHF). The blue line is price, the green line is the one-month (or shortterm) volatility, and the red line is three-month (or longer-term) volatility. For most of December 2003 the onemonth volatility was below the threemonth volatility, which coincided with the development of sharp down moves in USD/CHF. Between Feb. 24, 2004 and March 9, 2004, the one-month volatility spiked above the threemonth volatility, which coincided with a period of range trading.


All shapes and sizes


Volatility is expressed many ways — on different time frames and in term of option prices and past price fluctuations in an underlying market.
Understanding some simple volatility principles, such as mean reversion, can help you time trades when a volatility shift is likely to occur.

Pivot Points and Candlesticks Trading Strategy

Augmenting pivot point analysis with candlestick formations helps determine potential turning points in the forex market.

BY JOHN PERSON

Trade setups confirmed by independent techniques or tools — or those that occur simultaneously on different time frames — naturally carry more weight than those signaled by a single input. The trade examples outlined here combine pivot points with candlestick patterns to better pinpoint forex trade opportunities.
Pivot point analysis is based on mathematical calculations used to determine future support and resistance levels. The pivot point value is derived from the high, low and closing prices of the previous price bar, and is then added to and subtracted from the previous bar’s reference points to determine support and resistance levels for future trading. The pivot point (PP) formula is:

1. PP = (H + L + C)/3
2. First resistance level (R1) = (PP*2) - L
3. Second resistance level (R2) = PP + (H - L)
4. First support level (S1) = (PP*2) - H
5. Second support level (S2) = PP - (H - L)

There is some debate about which value should be used for the closing price in the virtually 24-hour forex market. In forex, all trades must be settled within two business days, which is established at the close of banking business at 5 p.m. ET. As a result, this is the time typically used for the closing price.


Using pivot points

Some traders use the pivot numbers to estimate the upcoming high or low, or to simply identify a level at which a market might change direction on an intraday basis.
A popular pivot-point approach is to cover any short positions and go long at either of the two support levels, or sell any long positions and go short at the projected resistance levels. Accordingly, while these price levels provide points at which to enter or exit the market, they also indicate where not to make trades. For example, you should not buy just below either of the resistance levels.
It is beneficial to use multiple time frames — e.g., monthly, weekly, and daily — to identify multiple pivot point support and resistance levels. A particular level has more significance when pivot points on two or more time frames coincide.
Combing pivot point levels with the price moves implied by candlestick patterns improves your odds of identifying favorable trade points.


Candlesticks

The components of a candlestick are derived from the same open, high, low, and close data that make up standard bar charts. The main component we are concerned with here is the relationship between the open and close of a session, which is called the candle’s “body” or “real body.” The color of a candlestick does not indicate whether it closed higher or lower than the preceding candle; rather, it reflects where the candle closed relative to the open.
In Figure 1, the trading period’s high and low are represented by the highest and lowest points of the candlestick, while the session’s open and close are represented by the top and bottom of the wider part of the candlestick. The thin lines at the tops and bottoms are called “shadows” (or wicks), and the wider parts are the real bodies. The candle is typically white (or hollow, or green) if the close was above the open and black (or red) if the close was below the open. Candle A closed higher than the open and candle B closed below the open. Candle C closed above the open — the open was the low price of the day, and the close was the high price of the day. Candle D illustrates the opposite condition. Finally, candle E opened and closed at the same price and is identical to its bar-chart equivalent.


Doji-based patterns: Indecision and reversal

Candlesticks are designed to make bullish and bearish momentum more evident on a price chart. This can highlight certain patterns, such as the high-close doji, that help determine a change in market direction or reversal.
A doji is a candle that opens and closes at (or very near) the same price — look again at Candle E in Figure 1. Such candles indicate indecision or uncertainty. Both buyers and sellers have lost confidence from the time the market opens, as price has pushed both higher and lower, only to end up where it started. Indecision is the last thing you want to see in a trending market. Rejection or failure from a high or low is a sign potential changes in the market are on the horizon.
In a strong downtrend, a market will usually close near its low as highly-capitalized traders hold or add to short positions overnight. If these bigmoney traders are not confident the market will close lower, the market may have the tendency to close back near the open.
Dojis sometimes appear as part of more reliable two- and three-candle formations, such as the morning star pattern, that highlight reversals. The basic morning star is a three-candle, bottom reversal pattern. When the pattern’s middle candle is a doji, it is called a morning doji star, as shown in Figure 2.
The first candle has a long, black real body (a lower close than open); the second candle has a small body that gaps below the first candle’s body. The third candle is a white candle (a higher close than open), and closes above the midpoint of the first candle’s real body. The third candle’s body may sometimes gap higher than the second candle’s body, as is the case in Figure 2.
There are several variations to this textbook description. For example, the initial black candle might have a small real body and the real body of the long white candle might entirely engulf the long dark candle or simply just partially penetrate its real body. The most important thing to notice is what happens after the doji candle. A candle after a doji that closes above the doji’s high confirms a directional change has occurred.

When either a morning doji star or simply a doji develops after a downtrend — especially if it is near an important target, such as a pivot point support level — it is likely if the next candle closes above the doji’s high, a reversal of the recent trend will occur. To trigger an entry, it is important for price to close above the doji’s high. This confirms the breakout and positive momentum should develop within a few bars.


Trade examples: Combining pivots and dojis

Lining up the pivot points on your screen before the beginning of a trading session prepares you for when a setup like a doji or morning doji star pattern develops.
Figure 3 is a 15-minute chart of the Euro/U.S. dollar rate (EUR/USD). On Dec. 10 (a Friday) the high was 1.3318, the low was 1.3148, and the close was 1.3241. The resulting pivot point levels for the following trading day (Dec. 13) are:

Pivot Point = 1.3236
R2 = 1.3406
R1 = 1.3323
S1 = 1.3153
S2 = 1.3066

On Dec. 13 the high turned out to be 1.3325, the low was 1.3192, and the close was 1.3313. The market did not precisely hit the S1 target number, but the low occurred almost exactly at the midpoint (1.3194) of the pivot point (1.3236) and S1 (1.3153). In a bullish market, the market will often hold between the S1 and the pivot point. It is at this price level you should look for setups such as the doji.


Figure 4 is a five-minute chart of the December 2004 EuroFx futures contract (ECZ04) from Nov. 16. Note that once the candle closes above the second doji candle’s high (see the green arrows), price has clearly changed direction.
This chart also provides a good example of how the market reacts near pivot point levels. On the previous day (Nov. 15), the high was 1.2999, the low was 1.2916, and the close was 1.2943. The pivot point was 1.2953 and the support and resistance levels were: R1 = 1.2989; R2 = 1.3036; S1 = 1.2906; and S2 = 1.2870. The high on Nov. 16 was 1.2996, the low was 1.2920, and the market closed at 1.2966.
There were two opportunities to trade from the long side using the doji method. The first doji, which made the low of the day (the first green arrow), was a morning doji star pattern. It formed below the daily pivot point. Notice that once the market closed above the doji’s high it triggered a long position. This up move stalled around the R1 level at 1.2989. (Also notice a doji appeared immediately after the high, and the market proceeded to trade lower.)


Trade management

A risk-control strategy to accompany this pattern might include placing a stop-loss order below the doji’s low by an amount that is 120 percent of the 10-day average range. You could also use a stop-close-only order (which is triggered only on the market close) below the doji’s low for the time period you are trading in.


All time frames

This method is applicable to both the forex market and currency futures, as well as different time frames. (The five-, 15-, 30-, and 60-minute time periods are especially useful in forex trading.) The confluence of trading signals can help identify points at which a market is likely correct or reverse, which is useful for entering trades as well as taking profits.

Narrowing breakout channels

System concept
Many trend-following systems use breakout channels that track high and low levels over certain look-back periods (e.g., 20 days) to determine trends. Once price crosses above or below the channel price, these systems enter the market in the breakout direction. However, because many trend followers enter the market when price exceeds these levels, it’s difficult to get a good fill.
This system narrows the breakout channel a bit to place trades before other traders do. Instead of waiting for price to cross its highest or lowest points over the last 20 days, this system enters at the second highest or lowest level. The system uses two indicators called HighestN and LowestN that return the nth highest or lowest price within any look-back period (these indicators are available free at www.Wealth-Lab.com).

Figure 1 shows several trade signals in the Euro FX futures (EC). The system held a short position on May 26, 2000 before reversing and going long once price crossed above the upper boundary of the second highest channel. Then, it exited and went short on July 13 after price crossed below its lower band — a 1.3- point gain.
The system held this short trade until Nov. 30, when it reversed again as price penetrated the upper channel — a 7-point profit. This final long trade exited on Jan. 24 with a 5.2-point profit. Each trade occurred slightly earlier and was more profitable than a standard breakout system based on 20-day highs and lows.

Rules:

1. Go long at stop at the second highest high of the last 20 days.
2. Exit long and go short at stop at the second lowest low of the last 20 days.

Test data
The system was tested on the following currency futures: British pound (BP), Euro FX (EC), Japanese yen (JY), Swiss franc (SF). This test used ratio-adjusted data from Pinnacle Data Corp. (www.pinnacledata.com).

Test period
January 1990 until January 2005.

Starting equity
Starting equity is $1,000,000. Deduct $20 commission per round-trip trade per contract. Apply two ticks of slippage per stop order.

Money management
Risk a maximum of three percent of current account equity per trade. The number of contracts per position is calculated using the basis price (the closing price of the entry bar), the stop-loss level, the contract’s point value (i.e., the dollar value of a one-point move), and the portfolio’s total equity.
For example, the S&P futures contract has a point value of $250. Assume the system goes long at 1,000 (the basis price) and the stop-loss is 900. To determine the trade’s dollar risk, multiply the point value ($250) by the difference between the basis price and the risk-stop (1,000 - 900 = 100). Therefore, a single contract’s dollar risk is $25,000.
If the portfolio’s total equity before entering the position was $1,000,000 and we do not want to risk more than 10 percent of our total equity ($100,000), we would buy four contracts.
Had total equity been less than $250,000, we would not have been able to take this position because its dollar risk would exceed our system’s 10-percent equity risk. This position-sizing method keeps us out of risky trades that have potential to ruin our account.


Test results
Figure 2’s equity curve increased steadily during the first five years. But the test’s second half was quite volatile, with high equity peaks and drawdowns of up to 48 percent — too high for most traders. Figure 3’s drawdown curve confirms this behavior. The system’s high volatility also resulted in a low Sharpe ratio (0.58).

However, its 10-year annualized gain was almost 12 percent. Also, the system’s exposure (8.55 percent) is very low — see Figure 2’s light green area. With such low exposure, you could increase your risk or invest the remaining capital somewhere else to flatten the equity curve.
We also tested the system across a wide range of parameters and compared the results to the traditional breakout system (i.e., highest high and lowest low). We ran separate tests with look-back periods from 10 to 60 days, and we also tested different parameters (n = 1, 2, and 3). All other variables (position sizing, commission, slippage, etc.) remained constant.

Figure 4 compares the different tests’ profitability. Note that all tests began on the 60th day so all results could be compared to each other. Thus, profits for the 20-day lookback period differ somewhat from the original results.
The figure shows the second highest/lowest levels (blue bars) outperformed the traditional break-out approach (yellow bars) for all periods except the 40-day window. Also, the third highest/lowest channel (red bars) boosted gains even further in eight of 11 cases.


Outcome
When waiting for a breakout signal, it makes sense to use a modified channel based on the second (or even third) highest/lowest price. While Figure 4 proved these narrower high/low levels can lead to higher profits, we only tested parameters from 1 to 3. Testing larger values (n = 4 or higher) would show whether results could be improved further. But don’t forget to also test the system across many look-back periods to ensure its stability.

Pbar Swing System


The system developer is Zunit. Here is the system thread in ForexFactory forum.

put this indicator in indicator folder here C:\Program Files\MetaTrader\experts\indicators

Pbar_ Indicator.mq4

Put this tpl file in the "templates folder" here C:\Program Files\MetaTrader\ templates

pbar_Template.tpl


Buy Signal:
1- RSI 2 period goes above the 50 level.
2- ADX 1 period is below the ADX 16 level.

Sell Signal:
1- RSI 2 period penetrate the 50 RSI level.
2- ADX 1 period goes above the 16 ADX level

Stop Lose
- 80 pips or the lowest low of the previous 3 bars.

Target profit
- Exit when the stochastic crosses.

Time frame
- All Time frames

Currency pair
- All pairs ( EUR/CHF Recommended )

any Question about the system i am here to answer

HAve A nICe tRADe

Wednesday, October 14, 2009

Trend Finder Daily Trading System


put this indicator in indicator folder here C:\Program Files\MetaTrader\experts\indicators

StochHistogram.mq4

Put this tpl file in the "templates folder" here C:\Program Files\MetaTrader\ templates

trend finder daily.tpl


Chart Setup:

Open a Daily Chart.
Add the trend finder daily Template to the chart.
Add a 200 Simple Moving Average.

Buy Signal:

1. Price is above the 200sma.
2. The Awesome Oscillator has changed to green.
3. The Stochastic Histogram has changed to green.


Sell Signal:

1. Price is Below the 200sma.
2. The Awesome Oscillator has changed to red.
3. The Stochastic Histogram has changed to red.


Money Management and Exit Strategy:

1. Open 2 trades which together risk no more than 3% of your total available balance.
2. Set a stop loss of -100 pips for both trades.

Trade 1: Set a take profit at +50 pips.
Trade 2: Set a take profit at +100 pips.
When you reach +50 pips, set the stop loss for the remaining trade to break even.

Time frame
- All Time frames

Currency pair
- All pairs

any Question about the system i am here to answer

HAve A nICe tRADe